| • |
Revenue |
| |
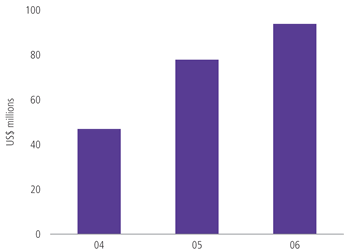
Group revenue for the year
was US$44,5 million, marginally down from the US$45,0
million reported for the previous year. |
| |
|
| |
The
following sets out revenue per operating segment for the
year under review: |
| |
| |
|
|
|
|
| |
31 March |
31 March |
|
|
|
2006 |
2005 |
Variance |
% |
| |
US$m |
US$m |
US$m |
change |
|
|
|
|
|
| Private Equity |
11,0 |
22,8 |
(11,8) |
(51,8) |
| Corporate Finance |
7,9 |
4,1 |
3,8 |
92,7 |
| Specialised Funds |
3,9 |
2,4 |
1,5 |
62,5 |
| Group Investments |
21,7 |
15,7 |
6,0 |
38,2 |
| Revenue |
44,5 |
45,0 |
(0,5) |
(1,1) |
|
|
|
|
|
|
| |
|
| |
The decrease of 51,8% in revenue
from Private Equity, was more than offset by the increase
in other private equity income, and was largely the result
of significant dividend received on the disposal of a
proprietary investment in the prior year.
Revenue from Corporate Finance and Specialised Funds,
which is predominantly fee income, increased substantially
from the previous year by 92,75% and 62,5% respectively,
albeit off a low base.
Group Investments' revenue, comprising primarily of interest
income in Bayport, increased by 38,2% and can be directly
attributed to the growth in the underlying business volumes. |
| |
|
| • |
Other
income |
| |
Other income increased by 50,3%
to US$49,3 million from US$32,8 million. |
| |
|
| |
The
following sets out the other income per operating segment
for the year under review: |
| |
| |
|
|
|
|
| |
31
March |
31 March |
|
|
|
2006 |
2005 |
Variance |
% |
| |
US$m |
US$m |
US$m |
change |
|
|
|
|
|
| Private Equity |
45,9 |
29,8 |
16,1 |
54,0 |
| Corporate Finance |
(0,1) |
(0,3) |
0,2 |
66,7 |
| Specialised Funds |
2,6 |
3,1 |
(0,5) |
(16,1) |
| Group Investments |
0,9 |
0,2 |
0,7 |
>100 |
| Other
income |
49,3 |
32,8 |
16,5 |
50,3 |
|
|
|
|
|
|
| |
|
| |
The increase in other income
is predominantly the result of fair value recognitions
of Private Equity's underlying funds and proprietary investments.
Unrealised fair value gains totalling US$41,9 million
are included in this income. |
| |
|
| |
|
| |
Revenue
and other income |
| |
 |
| |
|
| |
Page
up |
| |
|
| • |
Operating
expenses |
| |
Operating expenses increased
by 38% from US$30,9 million in the previous year to US$42,6
million and is primarily attributable to the following: |
| |
– |
an increase in Bayport’s
operating expenses which accounts for 33% of the total
increase; |
| |
– |
25% of the increase relates
to non-recurring abnormal charges of approximately US$4
million in private equity for: |
| |
|
|
> |
raising Brait IV |
| |
|
|
> |
new Private Equity accounting and administration
system; and |
| |
|
|
> |
infrastructural costs and performance awards
in Specialised Funds; and |
| |
– |
the balance of 4% to normal
inflationary increases. |
| |
|
| • |
Associates |
| |
Income from associates has
increased marginally from US$1,6 million to US$1,7 million
and comprises largely of the group's equity income share
from its 32% interest in its South African BEE partner
holding company, Sitogo Holdings (Pty) Limited. |
| |
|
| • |
Joint
ventures |
| |
The group's joint venture interests
comprise its 50% stake in Capital Alliance Finance (CAF).
No income was recorded on the group equity holding in
CAF's micro-lending business during the year as the operation
focused on collecting cash to repay shareholders' loans
rather than aggressively pursuing growth in its lending
book. A substantial amount of the shareowners' loans were
repaid and this policy will continue until the business
is self financing. |
| |
|
| • |
Finance
costs |
| |
Finance costs relate largely
to interest paid on the shareowners' loan from Brait's
BEE partner, Sitogo Holdings and the remainder of the
financing structure on Brait's Johannesburg office building
that was disposed of during the second half of the financial
year. |
| |
|
| • |
Capital
items |
| |
|
|
|
|
|
|
|
|
|
2006 |
2005 |
|
| Capital
items include the following: |
|
US$m |
US$m |
|
|
|
|
|
|
|
| – |
The fair value adjustment to the
financial liability of US$8,2 million,arising from
the 26% sale of the South African operations to
Brait’s BEE partner.* |
|
(1,4) |
(7,1) |
|
| – |
Profit generated on the disposal of part of Brait’s
interest in Bayport Holdings to new strategic partners
reducing its economic interest to 41,66%. |
|
2,9 |
– |
|
| – |
Currency hedge cost as referred to on page
12. |
|
(2,2) |
(4,1) |
|
| – |
Profit generated on the disposal of Brait’s
Johannesburg office building and fittings. |
|
2,8 |
– |
|
| – |
Realisation of translation adjustment following
the part repayment of the rand denominated loans
granted by Brait S.A.to Sitogo Holdings (Pty) Limited
and Brait South Africa Limited. |
|
(0,2) |
– |
|
| Total
capital items |
|
1,9 |
(11,2) |
|
|
|
|
|
|
|
|
| |
* |
The
purchase consideration paid by Sitogo to Brait S.A. for
its 26% interest in Brait South Africa is accounted for
under IFRS as a financial liability and not as a minority
shareowner. The financial liability is fair valued annually
to match the net asset value of Brait South Africa. |
| |
|
| • |
Taxation |
| |
The taxation expense for the
year of US$2,7 million arises primarily from Brait's non-South
African operations. In South Africa, the group has estimated
tax losses of some US$38,7 million at 31 March 2006 (2005:
US$38,2 million) of which US$8,6 million has been absorbed
by the deferred tax asset of US$2,8 million carried at
year-end. |
|



