| • |
Net cash generated from operating
and investment activities |
| |
– |
Operating
activities |
| |
|
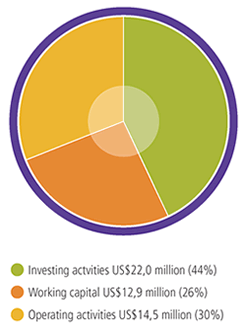
Operating cash, including dividend
and interest received reduced from US$20,6 million in
the previous year to US$12,9 million and is primarily
the result of lower dividends received on private equity
investments. |
| |
|
|
| |
– |
Working
capital |
| |
|
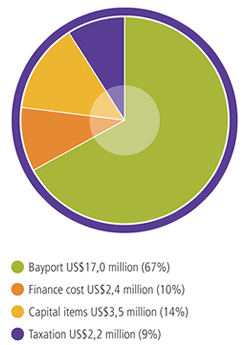
Working capital increase reflects
the significant growth in the Bayport advances book (US$17,0
million) that was partly offset by decreases in strategic
loans and other receivables. |
| |
|
|
| |
– |
Investing
activities |
| |
|
The net year-on-year inflow
of US$22,0 million on investing activities was largely
the result of proceeds received on the realisation of
private equity investments and the disposal of Brait's
Johannesburg office building and fittings. |
| |
|
| • |
Cash
flows from financing activities |
| |
The net year-on-year financing
activity inflow of US$61,7 million was attributed primarily
to the raising of US$72,9 million from the issue of redeemable
preference shares by the subsidiary company, Brait South
Africa Limited.The group also applied US$15,1 million
to settle the outstanding secured liability associated
with the funding of the office building and fittings that
were disposed of during the year.
At March 2006 the balance sheet was strong with approximately
53% (2005: 16%) of shareowners' capital held in cash and
cash equivalents. This balance includes a large portion
of the debt capital drawn just prior to year-end. |
| |
|
| |
An analysis
of cash generated and cash applied in operating and investment
activities is depicted in the following graphs: |
| |
|
| |
|
| |
Cash
generated
US$49,4 million |
| |
 |
| |
|
| |
|
| |
Cash
applied
US$25,1 million |
| |
 |



